Grass-Cast: A New, Experimental Grassland Productivity Forecast for the Great Plains
Every spring, ranchers face the same difficult challenge—trying to guess how much grass
will be available for livestock to graze during the upcoming summer. An innovative new
Grassland Productivity Forecast or “Grass-Cast” can help producers in the Great
Plains reduce this economically important source of uncertainty.
This new experimental grassland forecast is the result of a collaboration between Colorado State University, U.S. Department of Agriculture (USDA), the National Drought Mitigation Center at the University of Nebraska-Lincoln, and the University of Arizona. Funding for this project was provided
by the USDA Natural Resources Conservation Service (NRCS), USDA Agricultural
Research Service (ARS), and the National Drought Mitigation Center.
Grass-Cast uses almost 40 years of historical data on weather and vegetation growth—
combined with seasonal precipitation forecasts—to predict if rangelands in individual
grid cells (whose size is 10 km x 10km, or ~ 6 miles x 6 miles) are likely to produce
above-normal, near-normal, or below-normal amounts of vegetation.
As with any forecast, Grass-Cast’s accuracy depends on how far into the future we try to
look, according to ARS economist Dannele Peck, Director of the USDA Northern Plains
Climate Hub. Its accuracy improves with time as the growing season unfolds, so it should
be consulted more than just once during the growing season. Grass-Cast is updated every
two weeks to incorporate newly observed weather data and emerging trends in the
forecast, such as the flash drought in the western Dakotas and eastern Montana in 2017.
Grass-Cast also provides a view of rangeland productivity in the broader region, to assist
in larger-scale decision making—such as where grazing resources might be more
plentiful if a rancher’s own region is at risk of drought.
Grass-Cast provides ranchers and land managers with an indication of productivity in the
upcoming growing season relative to their area’s more nearly 40-year history. Ranchers
and land managers should use this information in combination with their local knowledge
of soils, plant communities, topography, and management to help with decision-making.
It should be noted that Grass-Cast cannot tell the difference between desirable forage
species and undesirable species. So it is important for producers to know what proportion
of a pasture is occupied by weeds, and how well those weeds respond to rain (or lack of
rain) compared to the desirable species. Producers should monitor these different
vegetation types to see if one is responding to the weather better than the other.
Furthermore, Grass-Cast does not directly account for local management practices, such
as grazing intensity in previous years. Producers should therefore adjust Grass-Cast’s
grid-level productivity estimates accordingly.
Producers should not rely on Grass-Cast as a sole source for making management
decisions. Similarly, public land managers should not use Grass-Cast as a sole source of
information for setting stocking rates, determining turnout dates, or other aspects of lease
agreements, allotments or permits.
Watch for updates on the Grass-Cast website or on Twitter (@PeckAgEc).
Project Contact: Dannele Peck, Director of the USDA Northern Plains Climate Hub, at
dannele.peck@ars.usda.gov or 970-744-9043.
Example
An example set of Grass-Cast maps, produced on April 29th for the summer of 2019, are
shown below. The left map shows, for each grid-cell (~6 miles x 6 miles in size), how
much vegetation is expected to grow (compared to the grid-cell’s 38-year average) if
precipitation in May-June-July-August (MJJA) is above-normal. A grid-cell in dark blue,
for example, is expected to have 30% more pounds per acre than its average. A grid-cell
in green is expected to have near-average (5% less or more) pounds per acre. The middle
map shows how much vegetation is expected to grow if MJJA precipitation is nearnormal.
A grid-cell in yellow, for example, is expected to have 5% to 15% less vegetation
than its average. The right map shows expected vegetation if MJJA precipitation is
below-normal. A grid-cell in red, for example, is expected to have 30% less vegetation
(or worse) than its average. For grid-cells in white or gray, no forecast is available due to
insufficient data or weak statistical relationships.
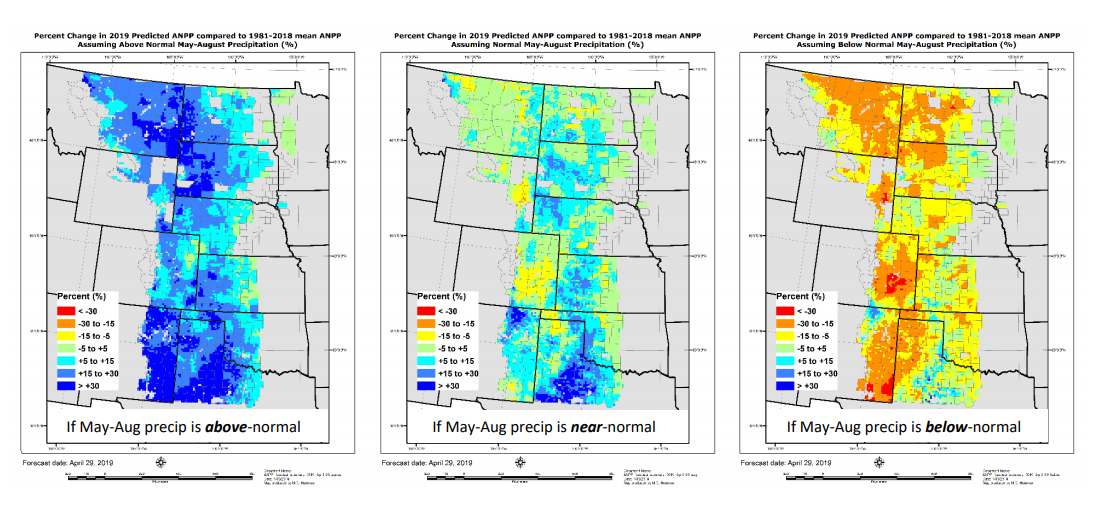
Example Grassland Productivity Forecast (“Grass-Cast”) maps for summer 2019, produced on April
29, 2019 (see Grass-Cast website for the most up-to-date maps). These three maps show the
forecasted percent change in grassland production compared to a grid-cell’s 38-year average. Left
map: percent change in pounds per acre if precipitation in May-June-July-August (MJJA) of 2019 is
above-normal. Middle map: percent change in production if MJJA precipitation is near-normal.
Right map: percent change in production if MJJA precipitation is below-normal. To see which map
(scenario) is more likely to occur in your area, please visit NOAA's long-range precipitation outlooks
at: https://www.cpc.ncep.noaa.gov/products/predictions/long_range/interactive/index.php.
For Example: In the maps above, much of the grid-cells in north-central Montana are medium-blue
(left map), green (middle map), and orange (right map). If May-Jun-Jul-Aug precipitation is abovenormal (left map),
those medium-blue grid-cells in north-central Montana rangelands are expected
to have 15 to 30% more pounds per acre of vegetation than their 38-year average. If MJJA
precipitation is near-normal (middle map), those green grid-cells in north-central Montana are
expected to have near-normal production, anywhere from 5% less to 5% more than their 38-year
average. If MJJA precipitation is below-normal (right map), those orange grid-cells in north-central
Montana are expected to have 15 to 30% less production than their 38-year average. For areas in
gray, Grass-Cast is not available due to insufficient data or weak statistical relationships.
Printable Version